

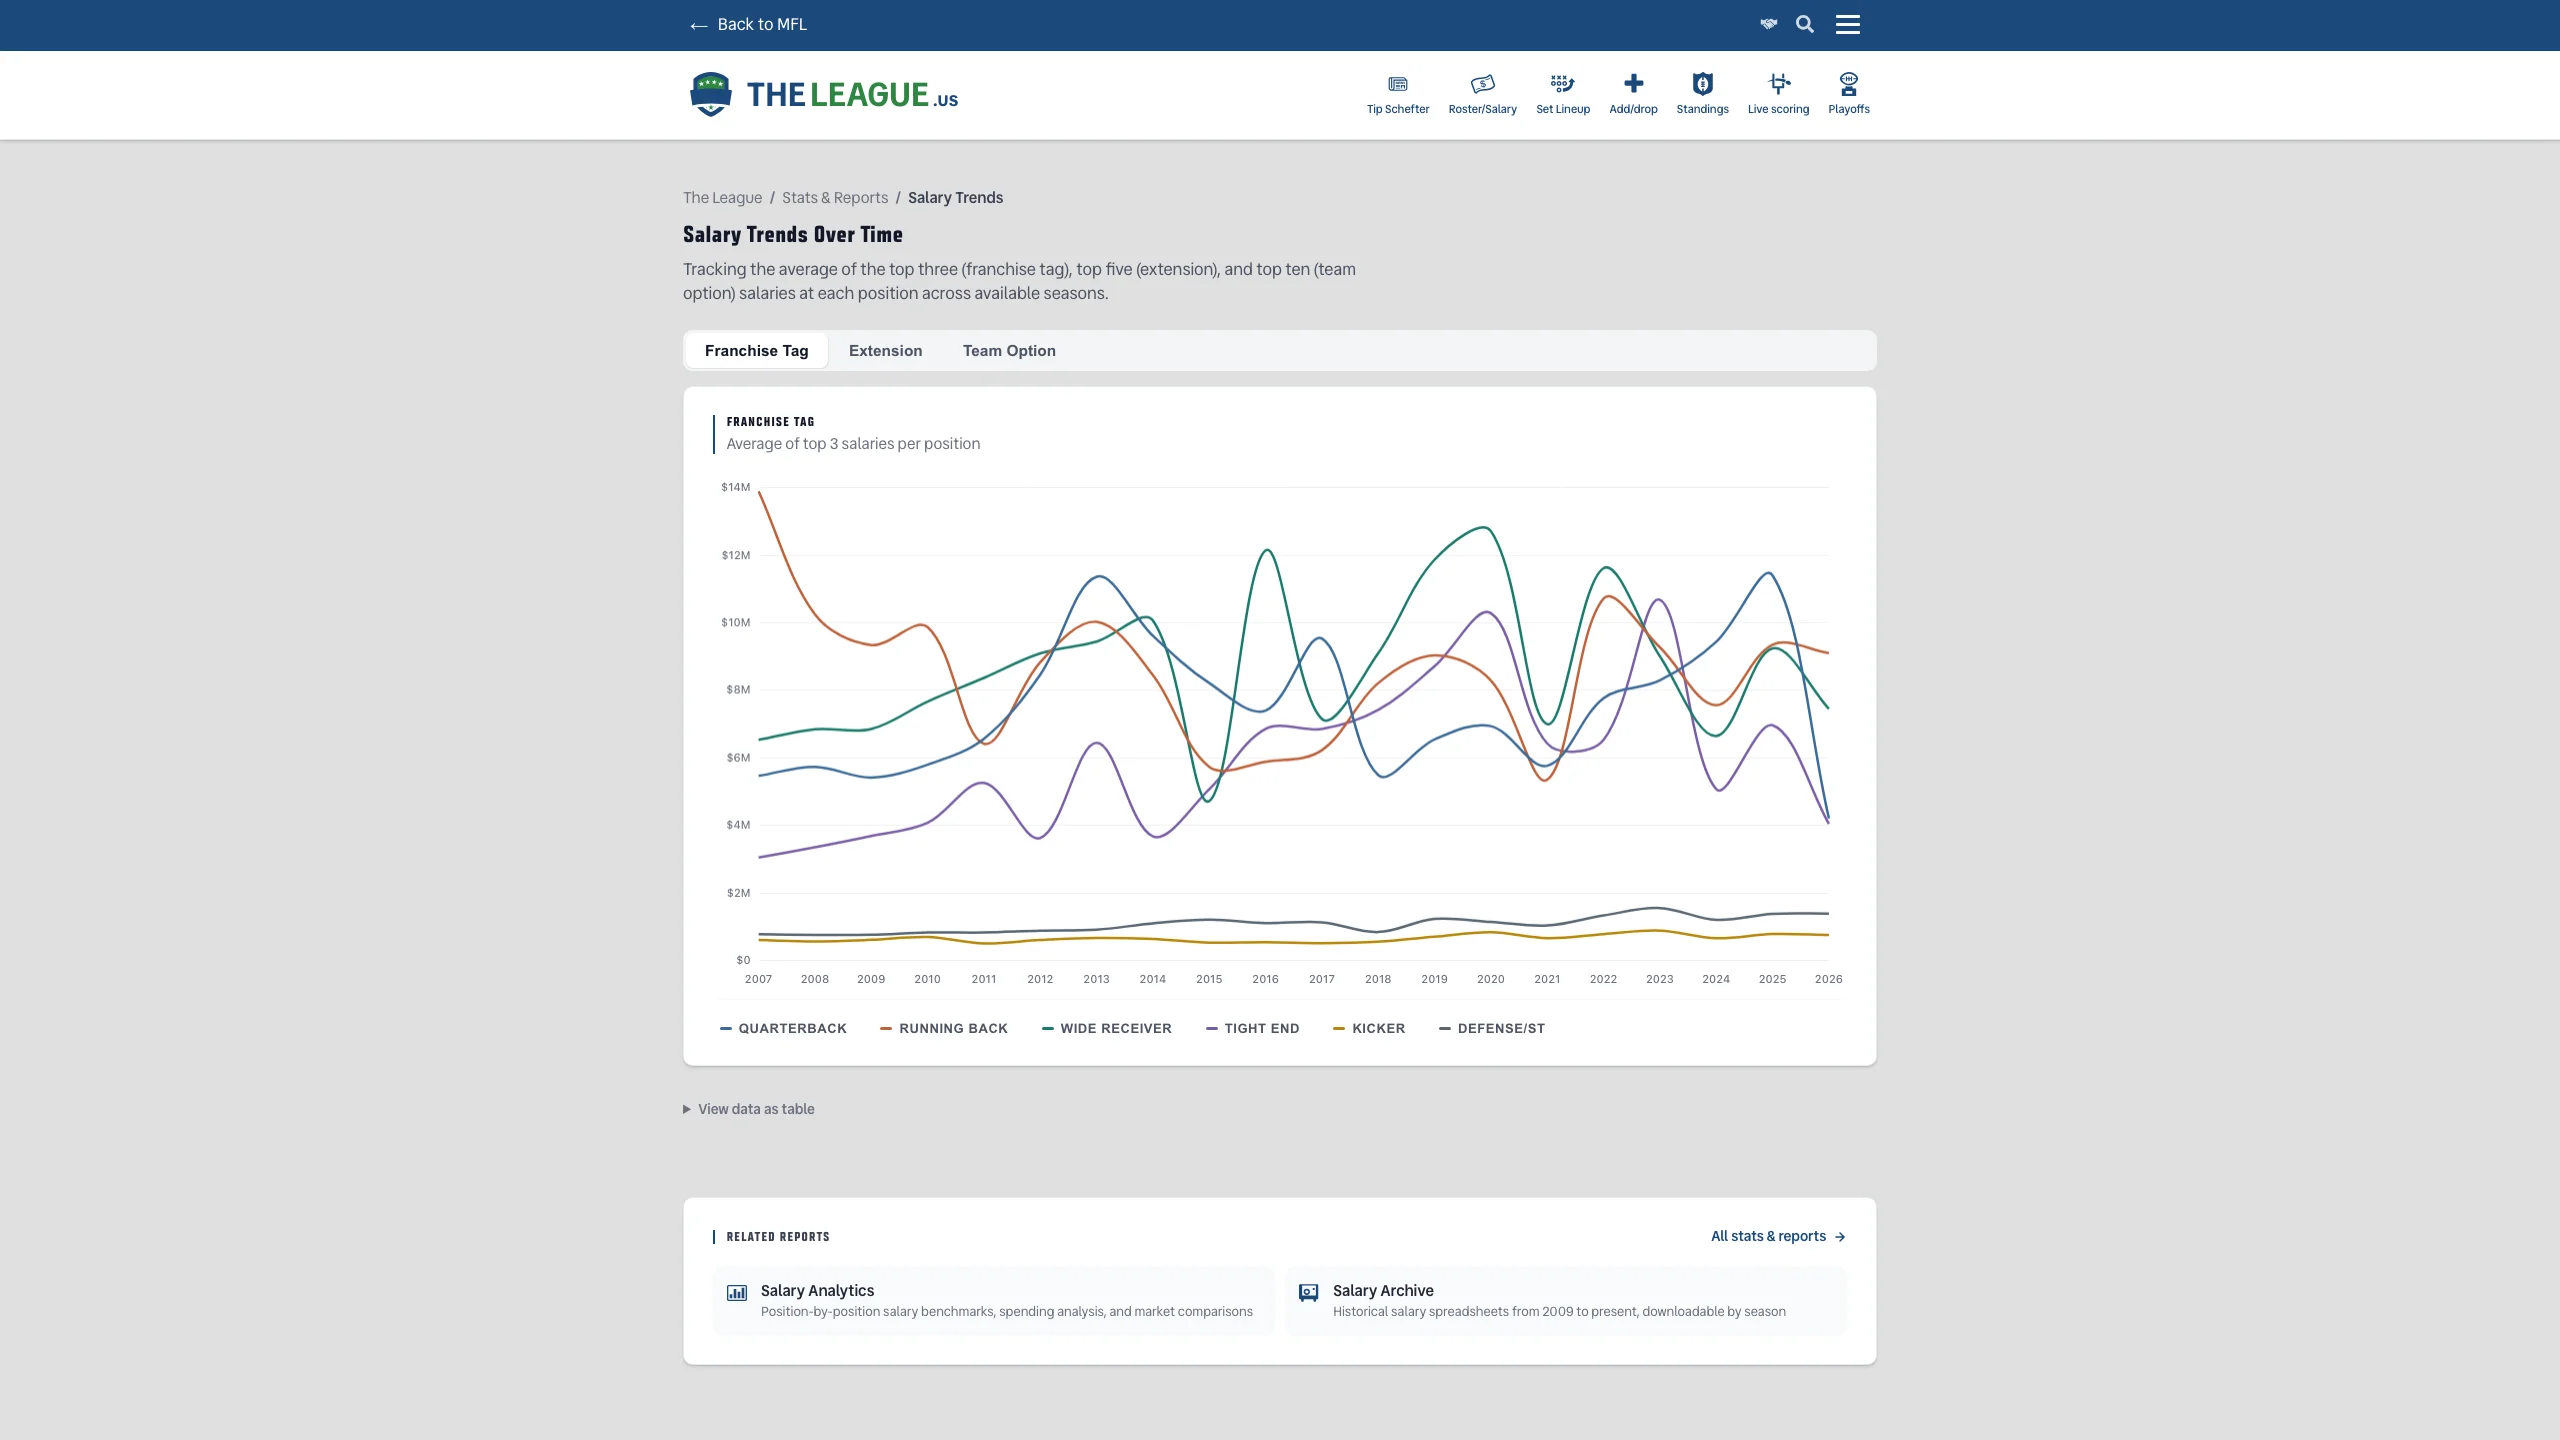
Salary History Charts
Track how team salary spending has changed across seasons.
The Full Story
Salary trends in a dynasty league are like tides: if you're not tracking them, you're going to get caught. The Salary History page provides interactive charts showing how franchise tag averages and extension averages have moved across seasons for every position group — QB, RB, WR, TE, PK, and DEF.
Toggle between franchise tag history (top 3 salary averages) and extension history (top 5 averages) to see which positions are inflating fastest. The multi-season view lets you overlay years to spot the trends that inform your next contract decision — like the fact that wide receiver salaries have been climbing at a rate that should concern anyone with three of them on long-term deals.
This is auction intelligence in chart form. Knowing that running back salaries dipped last year might mean value. Knowing that quarterback salaries have risen every year for five straight years means you should plan accordingly. Or ignore the data entirely and bid with your heart — the page will still be here when you want to understand what went wrong.
Message