
Cap Space
$487,799Viewing plan for
Front Office
Contracts, the cap, and every trade you’re thinking about. · 2026
—
—
— Points
— Per Game
— Pos Rank
— Contract
My Rank
This week
Details
Build —
Snaps
ADP
Status —
Draft ![]() —
College ![]() —
Contract —
Bye —
Latest News
More actions
No games logged for him this season.
Season Results
| Wk | Opp (rank vs pos) | Pts | Status |
|---|---|---|---|
| Total | — | ||
Pts vs his average Better Typical Worse
Matchup Easy (1st–8th) Tough (25th–32nd)
—
Player actions
Extensions
Franchise Tag Options (2027)
Potential franchise tag candidates
No players on their last year currently meet franchise tag criteria (top at position by rank, points, or salary).
Veteran Extension Candidates
Potential contract extension candidates
| Player | Current | Extended |
|---|---|---|
 Rico Dowdle  RB | $2,125,000 x 3 | $5,569,156 x 5 |
 Jaylen Warren RB | $1,200,000 x 3 | $4,644,156 x 5 |
 Chad Ryland  PK | $425,000 x 3 | $717,736 x 5 |
 Cleveland Defense DEF | $660,000 x 4 | $1,104,535 x 6 |
Free Agent Needs
| PTS | |||
|---|---|---|---|
| 1 |  Jaylen Wright  RB | 6.8 | |
| 2 |  Justice Hill  RB | 4.7 | |
| 3 |  Khalil Herbert  RB | 4.0 | |
| 4 |  Isaiah Davis  RB | 4.0 | |
| 5 |  Austin Ekeler  RB | 3.7 |
| PTS | |||
|---|---|---|---|
| 1 |  Foster Moreau  TE | 4.5 | |
| 2 |  Elijah Higgins TE | 4.2 | |
| 3 |  Jonnu Smith  TE | 4.0 | |
| 4 |  Drew Sample  TE | 3.6 | |
| 5 |  Austin Hooper TE | 3.4 |
| PTS | |||
|---|---|---|---|
| 1 |  Brandon McManus  PK | 6.5 | |
| 2 |  Zane Gonzalez PK | 5.6 | |
| 3 |  Drew Stevens PK | 5.2 | |
| 4 |  Cameron Dicker  PK | 5.1 | |
| 5 |  Joey Slye  PK | 5.0 |
| PTS | |||
|---|---|---|---|
| 1 |  Spencer Rattler  QB | 7.9 | |
| 2 |  Tua Tagovailoa QB | 3.6 | |
| 3 | 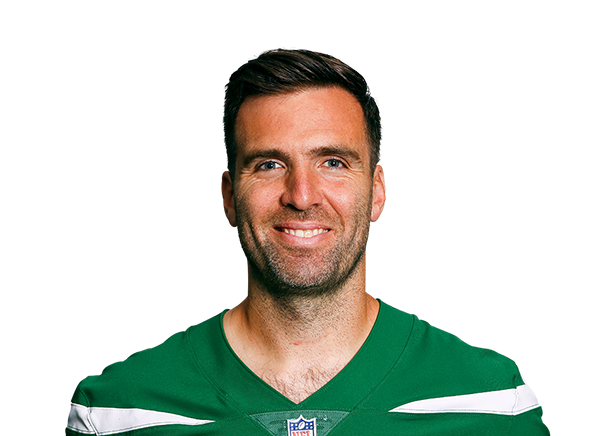 Joe Flacco QB | 3.5 | |
| 4 | 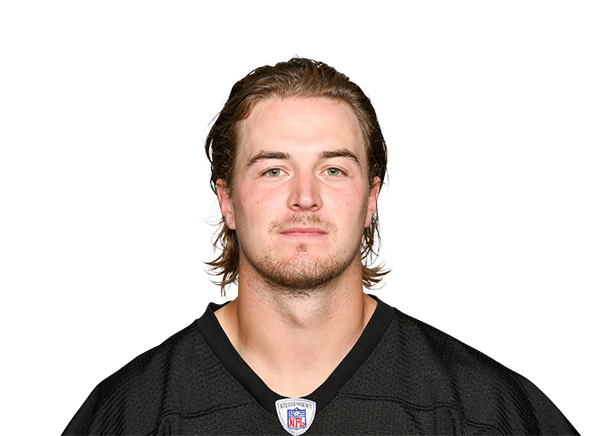 Kenny Pickett  QB | 2.4 | |
| 5 | 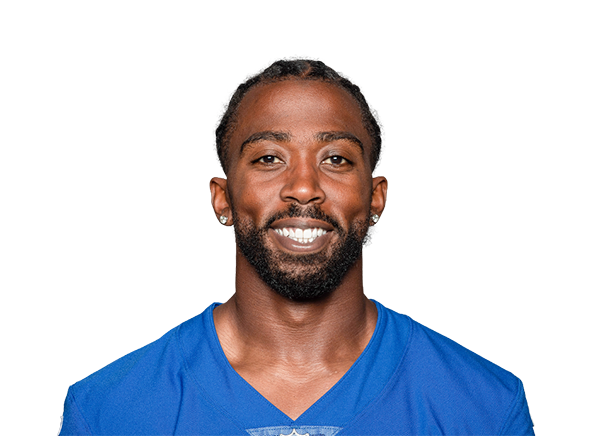 Tyrod Taylor QB | 2.0 |
| PTS | |||
|---|---|---|---|
| 1 | Jaylen Wright RB | 6.8 | |
| 2 | Justice Hill RB | 4.7 | |
| 3 | Khalil Herbert RB | 4.0 | |
| 4 | Isaiah Davis RB | 4.0 | |
| 5 | Austin Ekeler RB | 3.7 |
| PTS | |||
|---|---|---|---|
| 1 | Brandon McManus PK | 6.5 | |
| 2 | Zane Gonzalez PK | 5.6 | |
| 3 | Drew Stevens PK | 5.2 | |
| 4 | Cameron Dicker PK | 5.1 | |
| 5 | Joey Slye PK | 5.0 |
| PTS | |||
|---|---|---|---|
| 1 | Jaylen Wright RB | 6.8 | |
| 2 | Justice Hill RB | 4.7 | |
| 3 | Khalil Herbert RB | 4.0 | |
| 4 | Isaiah Davis RB | 4.0 | |
| 5 | Austin Ekeler RB | 3.7 |
| PTS | |||
|---|---|---|---|
| 1 | 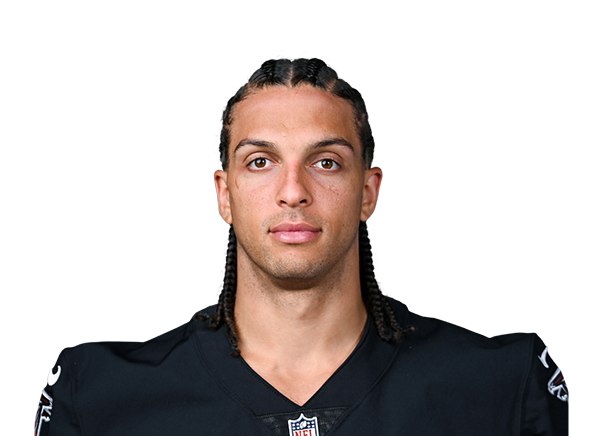 Mack Hollins  WR | 5.8 | |
| 2 | 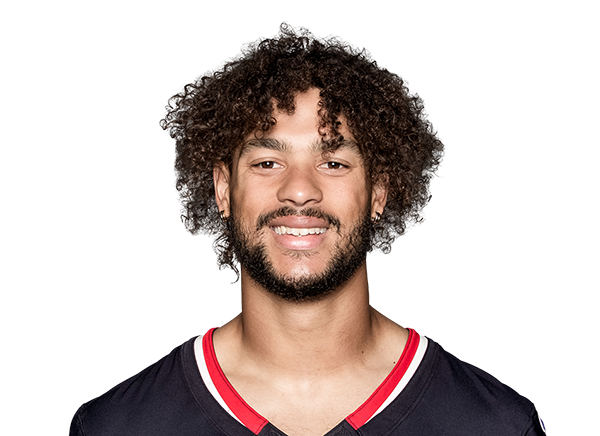 Xavier Hutchinson WR | 5.2 | |
| 3 | 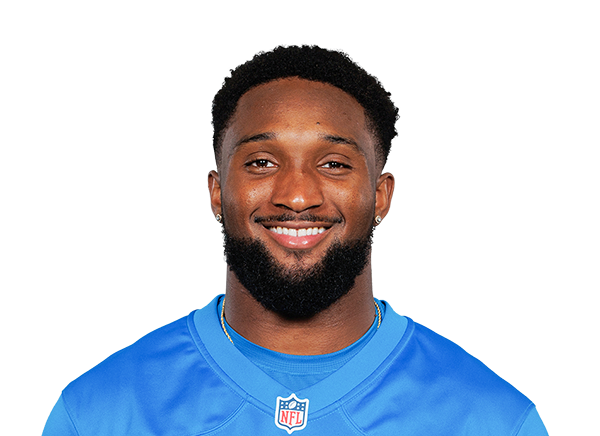 Isaiah Williams WR | 4.5 | |
| 4 | 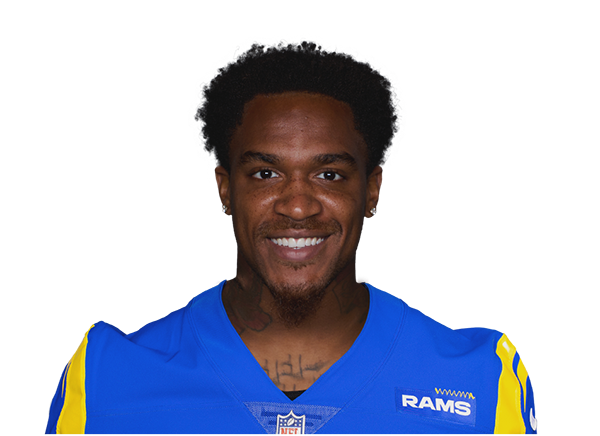 Demarcus Robinson  WR | 4.1 | |
| 5 | 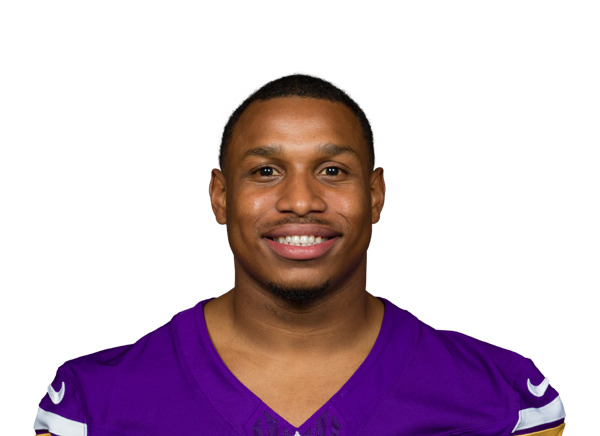 Myles Price  WR | 3.8 |
| PTS | |||
|---|---|---|---|
| 1 | Foster Moreau TE | 4.5 | |
| 2 | Elijah Higgins TE | 4.2 | |
| 3 | Jonnu Smith TE | 4.0 | |
| 4 | Drew Sample TE | 3.6 | |
| 5 | Austin Hooper TE | 3.4 |
| PTS | |||
|---|---|---|---|
| 1 | Brandon McManus PK | 6.5 | |
| 2 | Zane Gonzalez PK | 5.6 | |
| 3 | Drew Stevens PK | 5.2 | |
| 4 | Cameron Dicker PK | 5.1 | |
| 5 | Joey Slye PK | 5.0 |
| PTS | |||
|---|---|---|---|
| 1 | Mack Hollins WR | 5.8 | |
| 2 | Xavier Hutchinson WR | 5.2 | |
| 3 | Isaiah Williams WR | 4.5 | |
| 4 | Demarcus Robinson WR | 4.1 | |
| 5 | Myles Price WR | 3.8 |
| PTS | |||
|---|---|---|---|
| 1 | Spencer Rattler QB | 7.9 | |
| 2 | Tua Tagovailoa QB | 3.6 | |
| 3 | Joe Flacco QB | 3.5 | |
| 4 | Kenny Pickett QB | 2.4 | |
| 5 | Tyrod Taylor QB | 2.0 |
| PTS | |||
|---|---|---|---|
| 1 | Jaylen Wright RB | 6.8 | |
| 2 | Justice Hill RB | 4.7 | |
| 3 | Khalil Herbert RB | 4.0 | |
| 4 | Isaiah Davis RB | 4.0 | |
| 5 | Austin Ekeler RB | 3.7 |
| PTS | |||
|---|---|---|---|
| 1 | Mack Hollins WR | 5.8 | |
| 2 | Xavier Hutchinson WR | 5.2 | |
| 3 | Isaiah Williams WR | 4.5 | |
| 4 | Demarcus Robinson WR | 4.1 | |
| 5 | Myles Price WR | 3.8 |
| PTS | |||
|---|---|---|---|
| 1 | Foster Moreau TE | 4.5 | |
| 2 | Elijah Higgins TE | 4.2 | |
| 3 | Jonnu Smith TE | 4.0 | |
| 4 | Drew Sample TE | 3.6 | |
| 5 | Austin Hooper TE | 3.4 |
| PTS | |||
|---|---|---|---|
| 1 | Brandon McManus PK | 6.5 | |
| 2 | Zane Gonzalez PK | 5.6 | |
| 3 | Drew Stevens PK | 5.2 | |
| 4 | Cameron Dicker PK | 5.1 | |
| 5 | Joey Slye PK | 5.0 |
| PTS | |||
|---|---|---|---|
| 1 | Spencer Rattler QB | 7.9 | |
| 2 | Tua Tagovailoa QB | 3.6 | |
| 3 | Joe Flacco QB | 3.5 | |
| 4 | Kenny Pickett QB | 2.4 | |
| 5 | Tyrod Taylor QB | 2.0 |
| PTS | |||
|---|---|---|---|
| 1 | Jaylen Wright RB | 6.8 | |
| 2 | Justice Hill RB | 4.7 | |
| 3 | Khalil Herbert RB | 4.0 | |
| 4 | Isaiah Davis RB | 4.0 | |
| 5 | Austin Ekeler RB | 3.7 |
| PTS | |||
|---|---|---|---|
| 1 | Mack Hollins WR | 5.8 | |
| 2 | Xavier Hutchinson WR | 5.2 | |
| 3 | Isaiah Williams WR | 4.5 | |
| 4 | Demarcus Robinson WR | 4.1 | |
| 5 | Myles Price WR | 3.8 |
| PTS | |||
|---|---|---|---|
| 1 | Brandon McManus PK | 6.5 | |
| 2 | Zane Gonzalez PK | 5.6 | |
| 3 | Drew Stevens PK | 5.2 | |
| 4 | Cameron Dicker PK | 5.1 | |
| 5 | Joey Slye PK | 5.0 |
| PTS | |||
|---|---|---|---|
| 1 | Spencer Rattler QB | 7.9 | |
| 2 | Tua Tagovailoa QB | 3.6 | |
| 3 | Joe Flacco QB | 3.5 | |
| 4 | Kenny Pickett QB | 2.4 | |
| 5 | Tyrod Taylor QB | 2.0 |
| PTS | |||
|---|---|---|---|
| 1 | Jaylen Wright RB | 6.8 | |
| 2 | Justice Hill RB | 4.7 | |
| 3 | Khalil Herbert RB | 4.0 | |
| 4 | Isaiah Davis RB | 4.0 | |
| 5 | Austin Ekeler RB | 3.7 |
| PTS | |||
|---|---|---|---|
| 1 | Mack Hollins WR | 5.8 | |
| 2 | Xavier Hutchinson WR | 5.2 | |
| 3 | Isaiah Williams WR | 4.5 | |
| 4 | Demarcus Robinson WR | 4.1 | |
| 5 | Myles Price WR | 3.8 |
| PTS | |||
|---|---|---|---|
| 1 | Foster Moreau TE | 4.5 | |
| 2 | Elijah Higgins TE | 4.2 | |
| 3 | Jonnu Smith TE | 4.0 | |
| 4 | Drew Sample TE | 3.6 | |
| 5 | Austin Hooper TE | 3.4 |
| PTS | |||
|---|---|---|---|
| 1 | Spencer Rattler QB | 7.9 | |
| 2 | Tua Tagovailoa QB | 3.6 | |
| 3 | Joe Flacco QB | 3.5 | |
| 4 | Kenny Pickett QB | 2.4 | |
| 5 | Tyrod Taylor QB | 2.0 |
| PTS | |||
|---|---|---|---|
| 1 | Jaylen Wright RB | 6.8 | |
| 2 | Justice Hill RB | 4.7 | |
| 3 | Khalil Herbert RB | 4.0 | |
| 4 | Isaiah Davis RB | 4.0 | |
| 5 | Austin Ekeler RB | 3.7 |
| PTS | |||
|---|---|---|---|
| 1 | Mack Hollins WR | 5.8 | |
| 2 | Xavier Hutchinson WR | 5.2 | |
| 3 | Isaiah Williams WR | 4.5 | |
| 4 | Demarcus Robinson WR | 4.1 | |
| 5 | Myles Price WR | 3.8 |
| PTS | |||
|---|---|---|---|
| 1 | Brandon McManus PK | 6.5 | |
| 2 | Zane Gonzalez PK | 5.6 | |
| 3 | Drew Stevens PK | 5.2 | |
| 4 | Cameron Dicker PK | 5.1 | |
| 5 | Joey Slye PK | 5.0 |
| PTS | |||
|---|---|---|---|
| 1 | Spencer Rattler QB | 7.9 | |
| 2 | Tua Tagovailoa QB | 3.6 | |
| 3 | Joe Flacco QB | 3.5 | |
| 4 | Kenny Pickett QB | 2.4 | |
| 5 | Tyrod Taylor QB | 2.0 |
| PTS | |||
|---|---|---|---|
| 1 | Jaylen Wright RB | 6.8 | |
| 2 | Justice Hill RB | 4.7 | |
| 3 | Khalil Herbert RB | 4.0 | |
| 4 | Isaiah Davis RB | 4.0 | |
| 5 | Austin Ekeler RB | 3.7 |
| PTS | |||
|---|---|---|---|
| 1 | Mack Hollins WR | 5.8 | |
| 2 | Xavier Hutchinson WR | 5.2 | |
| 3 | Isaiah Williams WR | 4.5 | |
| 4 | Demarcus Robinson WR | 4.1 | |
| 5 | Myles Price WR | 3.8 |
| PTS | |||
|---|---|---|---|
| 1 | Jaylen Wright RB | 6.8 | |
| 2 | Justice Hill RB | 4.7 | |
| 3 | Khalil Herbert RB | 4.0 | |
| 4 | Isaiah Davis RB | 4.0 | |
| 5 | Austin Ekeler RB | 3.7 |
| PTS | |||
|---|---|---|---|
| 1 | Mack Hollins WR | 5.8 | |
| 2 | Xavier Hutchinson WR | 5.2 | |
| 3 | Isaiah Williams WR | 4.5 | |
| 4 | Demarcus Robinson WR | 4.1 | |
| 5 | Myles Price WR | 3.8 |
| PTS | |||
|---|---|---|---|
| 1 | Foster Moreau TE | 4.5 | |
| 2 | Elijah Higgins TE | 4.2 | |
| 3 | Jonnu Smith TE | 4.0 | |
| 4 | Drew Sample TE | 3.6 | |
| 5 | Austin Hooper TE | 3.4 |
| PTS | |||
|---|---|---|---|
| 1 | Spencer Rattler QB | 7.9 | |
| 2 | Tua Tagovailoa QB | 3.6 | |
| 3 | Joe Flacco QB | 3.5 | |
| 4 | Kenny Pickett QB | 2.4 | |
| 5 | Tyrod Taylor QB | 2.0 |
| PTS | |||
|---|---|---|---|
| 1 | Jaylen Wright RB | 6.8 | |
| 2 | Justice Hill RB | 4.7 | |
| 3 | Khalil Herbert RB | 4.0 | |
| 4 | Isaiah Davis RB | 4.0 | |
| 5 | Austin Ekeler RB | 3.7 |
| PTS | |||
|---|---|---|---|
| 1 | Mack Hollins WR | 5.8 | |
| 2 | Xavier Hutchinson WR | 5.2 | |
| 3 | Isaiah Williams WR | 4.5 | |
| 4 | Demarcus Robinson WR | 4.1 | |
| 5 | Myles Price WR | 3.8 |
| PTS | |||
|---|---|---|---|
| 1 | Foster Moreau TE | 4.5 | |
| 2 | Elijah Higgins TE | 4.2 | |
| 3 | Jonnu Smith TE | 4.0 | |
| 4 | Drew Sample TE | 3.6 | |
| 5 | Austin Hooper TE | 3.4 |
| PTS | |||
|---|---|---|---|
| 1 | Spencer Rattler QB | 7.9 | |
| 2 | Tua Tagovailoa QB | 3.6 | |
| 3 | Joe Flacco QB | 3.5 | |
| 4 | Kenny Pickett QB | 2.4 | |
| 5 | Tyrod Taylor QB | 2.0 |
| PTS | |||
|---|---|---|---|
| 1 | Jaylen Wright RB | 6.8 | |
| 2 | Justice Hill RB | 4.7 | |
| 3 | Khalil Herbert RB | 4.0 | |
| 4 | Isaiah Davis RB | 4.0 | |
| 5 | Austin Ekeler RB | 3.7 |
| PTS | |||
|---|---|---|---|
| 1 | Mack Hollins WR | 5.8 | |
| 2 | Xavier Hutchinson WR | 5.2 | |
| 3 | Isaiah Williams WR | 4.5 | |
| 4 | Demarcus Robinson WR | 4.1 | |
| 5 | Myles Price WR | 3.8 |
| PTS | |||
|---|---|---|---|
| 1 | Foster Moreau TE | 4.5 | |
| 2 | Elijah Higgins TE | 4.2 | |
| 3 | Jonnu Smith TE | 4.0 | |
| 4 | Drew Sample TE | 3.6 | |
| 5 | Austin Hooper TE | 3.4 |
| PTS | |||
|---|---|---|---|
| 1 | Brandon McManus PK | 6.5 | |
| 2 | Zane Gonzalez PK | 5.6 | |
| 3 | Drew Stevens PK | 5.2 | |
| 4 | Cameron Dicker PK | 5.1 | |
| 5 | Joey Slye PK | 5.0 |
| PTS | |||
|---|---|---|---|
| 1 | Jaylen Wright RB | 6.8 | |
| 2 | Justice Hill RB | 4.7 | |
| 3 | Khalil Herbert RB | 4.0 | |
| 4 | Isaiah Davis RB | 4.0 | |
| 5 | Austin Ekeler RB | 3.7 |
| PTS | |||
|---|---|---|---|
| 1 | Foster Moreau TE | 4.5 | |
| 2 | Elijah Higgins TE | 4.2 | |
| 3 | Jonnu Smith TE | 4.0 | |
| 4 | Drew Sample TE | 3.6 | |
| 5 | Austin Hooper TE | 3.4 |
| PTS | |||
|---|---|---|---|
| 1 | Spencer Rattler QB | 7.9 | |
| 2 | Tua Tagovailoa QB | 3.6 | |
| 3 | Joe Flacco QB | 3.5 | |
| 4 | Kenny Pickett QB | 2.4 | |
| 5 | Tyrod Taylor QB | 2.0 |
| PTS | |||
|---|---|---|---|
| 1 | Mack Hollins WR | 5.8 | |
| 2 | Xavier Hutchinson WR | 5.2 | |
| 3 | Isaiah Williams WR | 4.5 | |
| 4 | Demarcus Robinson WR | 4.1 | |
| 5 | Myles Price WR | 3.8 |
| PTS | |||
|---|---|---|---|
| 1 | Foster Moreau TE | 4.5 | |
| 2 | Elijah Higgins TE | 4.2 | |
| 3 | Jonnu Smith TE | 4.0 | |
| 4 | Drew Sample TE | 3.6 | |
| 5 | Austin Hooper TE | 3.4 |
| PTS | |||
|---|---|---|---|
| 1 | Jaylen Wright RB | 6.8 | |
| 2 | Justice Hill RB | 4.7 | |
| 3 | Khalil Herbert RB | 4.0 | |
| 4 | Isaiah Davis RB | 4.0 | |
| 5 | Austin Ekeler RB | 3.7 |
| PTS | |||
|---|---|---|---|
| 1 | Mack Hollins WR | 5.8 | |
| 2 | Xavier Hutchinson WR | 5.2 | |
| 3 | Isaiah Williams WR | 4.5 | |
| 4 | Demarcus Robinson WR | 4.1 | |
| 5 | Myles Price WR | 3.8 |
| PTS | |||
|---|---|---|---|
| 1 | Brandon McManus PK | 6.5 | |
| 2 | Zane Gonzalez PK | 5.6 | |
| 3 | Drew Stevens PK | 5.2 | |
| 4 | Cameron Dicker PK | 5.1 | |
| 5 | Joey Slye PK | 5.0 |
| PTS | |||
|---|---|---|---|
| 1 | Jaylen Wright RB | 6.8 | |
| 2 | Justice Hill RB | 4.7 | |
| 3 | Khalil Herbert RB | 4.0 | |
| 4 | Isaiah Davis RB | 4.0 | |
| 5 | Austin Ekeler RB | 3.7 |
| PTS | |||
|---|---|---|---|
| 1 | Brandon McManus PK | 6.5 | |
| 2 | Zane Gonzalez PK | 5.6 | |
| 3 | Drew Stevens PK | 5.2 | |
| 4 | Cameron Dicker PK | 5.1 | |
| 5 | Joey Slye PK | 5.0 |
2026 at a Glance
Avg per Player*
$0 × 1Players Signed
21Dead Money
$1,019,851Average Age
27.2 yearsDraft Assets
Roster Analytics
Cap allocation
$37.2M of $45.0M committed
- Active $32.4M 72%
- Practice $225,000 1%
- Injured Reserve $3.2M 7%
- Dead Money $1.4M 3%
- Available $7.8M 17%
Roster composition
Active vs IR vs practice vs open
- Active 19 76%
- Practice 1 4%
- Injured Reserve 4 16%
- Open 1 4%
Spend by position
Current-year cap dollars
- QB $1.5M
- RB $9.7M
- WR $17.5M
- TE $4.7M
- PK $467,500
- DEF $1.9M
Cap efficiency
Cost per fantasy point — lower is better
- QB $3,359
- RB $22,383
- WR $28,543
- TE $22,760
- PK $3,883
- DEF $21,067
Position composition
24 players on roster
- QB 2 8%
- RB 7 29%
- WR 7 29%
- TE 6 25%
- PK 1 4%
- DEF 1 4%
Age by position
Each dot is a player
Age
Average / range
25.0 Avg age
Youngest Trevor Etienne 22
Oldest Jakobi Meyers 30
Age distribution
How your roster splits by age
- ≤23 6
- 24–26 14
- 27–29 1
- 30+ 2
Cap allocation
$44.6M of $45.0M committed
- Active $37.3M 83%
- Practice $1.0M 2%
- Injured Reserve $3.6M 8%
- Dead Money $2.7M 6%
- Available $438,073 1%
Roster composition
Active vs IR vs practice vs open
- Active 17 68%
- Practice 3 12%
- Injured Reserve 5 20%
Spend by position
Current-year cap dollars
- QB $3.9M
- RB $10.3M
- WR $19.8M
- TE $5.2M
- PK $1.0M
- DEF $1.6M
Cap efficiency
Cost per fantasy point — lower is better
- QB $8,928
- RB $22,858
- WR $36,252
- TE $18,725
- PK $5,194
- DEF $6,208
Position composition
25 players on roster
- QB 5 20%
- RB 6 24%
- WR 7 28%
- TE 3 12%
- PK 2 8%
- DEF 2 8%
Age by position
Each dot is a player
Age
Average / range
26.0 Avg age
Youngest Braelon Allen 22
Oldest Geno Smith 36
Age distribution
How your roster splits by age
- ≤23 7
- 24–26 8
- 27–29 4
- 30+ 4
Cap allocation
$44.0M of $45.0M committed
- Active $37.6M 84%
- Practice $225,000 1%
- Injured Reserve $3.1M 7%
- Dead Money $3.0M 7%
- Available $1.0M 2%
Roster composition
Active vs IR vs practice vs open
- Active 22 88%
- Practice 1 4%
- Injured Reserve 1 4%
- Open 1 4%
Spend by position
Current-year cap dollars
- QB $11.7M
- RB $5.3M
- WR $17.0M
- TE $4.0M
- PK $1.0M
- DEF $2.0M
Cap efficiency
Cost per fantasy point — lower is better
- QB $17,894
- RB $8,731
- WR $27,256
- TE $14,473
- PK $4,769
- DEF $8,646
Position composition
24 players on roster
- QB 3 13%
- RB 6 25%
- WR 6 25%
- TE 4 17%
- PK 2 8%
- DEF 3 13%
Age by position
Each dot is a player
Age
Average / range
27.2 Avg age
Youngest Antonio Williams 22
Oldest Chris Boswell 35
Age distribution
How your roster splits by age
- ≤23 5
- 24–26 1
- 27–29 12
- 30+ 3
Cap allocation
$44.0M of $45.0M committed
- Active $40.9M 91%
- Practice $500,000 1%
- Dead Money $2.6M 6%
- Available $951,864 2%
Roster composition
Active vs IR vs practice vs open
- Active 20 80%
- Practice 2 8%
- Open 3 12%
Spend by position
Current-year cap dollars
- QB $14.9M
- RB $7.0M
- WR $8.9M
- TE $8.4M
- PK $850,000
- DEF $1.3M
Cap efficiency
Cost per fantasy point — lower is better
- QB $17,099
- RB $14,863
- WR $14,055
- TE $31,043
- DEF $4,924
Position composition
22 players on roster
- QB 4 18%
- RB 4 18%
- WR 7 32%
- TE 3 14%
- PK 2 9%
- DEF 2 9%
Age by position
Each dot is a player
Age
Average / range
28.3 Avg age
Youngest Omar Cooper Jr. 22
Oldest Aaron Rodgers 42
Age distribution
How your roster splits by age
- ≤23 5
- 24–26 5
- 27–29 3
- 30+ 7
Cap allocation
$35.2M of $45.0M committed
- Active $31.9M 71%
- Practice $237,500 1%
- Injured Reserve $1.5M 3%
- Dead Money $1.5M 3%
- Available $9.8M 22%
Roster composition
Active vs IR vs practice vs open
- Active 21 84%
- Practice 1 4%
- Injured Reserve 2 8%
- Open 1 4%
Spend by position
Current-year cap dollars
- QB $4.3M
- RB $11.0M
- WR $10.9M
- TE $4.6M
- PK $958,320
- DEF $1.9M
Cap efficiency
Cost per fantasy point — lower is better
- QB $9,182
- RB $29,104
- WR $25,844
- TE $31,232
- PK $8,973
- DEF $13,098
Position composition
24 players on roster
- QB 3 13%
- RB 7 29%
- WR 7 29%
- TE 4 17%
- PK 1 4%
- DEF 2 8%
Age by position
Each dot is a player
Age
Average / range
26.4 Avg age
Youngest Kenyon Sadiq 21
Oldest Harrison Butker 31
Age distribution
How your roster splits by age
- ≤23 3
- 24–26 9
- 27–29 6
- 30+ 4
Cap allocation
$44.8M of $45.0M committed
- Active $34.9M 78%
- Practice $237,500 1%
- Dead Money $9.6M 21%
- Available $218,003 0%
Roster composition
Active vs IR vs practice vs open
- Active 20 80%
- Practice 1 4%
- Open 4 16%
Spend by position
Current-year cap dollars
- QB $1.1M
- RB $5.8M
- WR $20.7M
- TE $5.4M
- PK $1.1M
- DEF $1.1M
Cap efficiency
Cost per fantasy point — lower is better
- QB $2,274
- RB $12,183
- WR $29,964
- TE $21,889
- PK $4,704
- DEF $10,161
Position composition
21 players on roster
- QB 2 10%
- RB 3 14%
- WR 11 52%
- TE 2 10%
- PK 2 10%
- DEF 1 5%
Age by position
Each dot is a player
Age
Average / range
27.1 Avg age
Youngest KC Concepcion 22
Oldest Travis Kelce 37
Age distribution
How your roster splits by age
- ≤23 2
- 24–26 9
- 27–29 5
- 30+ 4
Cap allocation
$38.0M of $45.0M committed
- Active $34.8M 77%
- Practice $700,000 2%
- Injured Reserve $450,000 1%
- Dead Money $2.0M 5%
- Available $7.0M 16%
Roster composition
Active vs IR vs practice vs open
- Active 22 85%
- Practice 3 12%
- Injured Reserve 1 4%
Spend by position
Current-year cap dollars
- QB $6.0M
- RB $6.7M
- WR $14.4M
- TE $5.4M
- PK $1.2M
- DEF $2.3M
Cap efficiency
Cost per fantasy point — lower is better
- QB $20,116
- RB $41,682
- WR $28,667
- TE $14,692
- PK $5,698
- DEF $10,799
Position composition
26 players on roster
- QB 3 12%
- RB 5 19%
- WR 9 35%
- TE 4 15%
- PK 2 8%
- DEF 3 12%
Age by position
Each dot is a player
Age
Average / range
24.3 Avg age
Youngest Chris Bell 22
Oldest Cairo Santos 34
Age distribution
How your roster splits by age
- ≤23 13
- 24–26 6
- 27–29 3
- 30+ 1
Cap allocation
$42.6M of $45.0M committed
- Active $39.5M 88%
- Practice $450,000 1%
- Injured Reserve $1.4M 3%
- Dead Money $1.3M 3%
- Available $2.4M 5%
Roster composition
Active vs IR vs practice vs open
- Active 22 81%
- Practice 2 7%
- Injured Reserve 3 11%
Spend by position
Current-year cap dollars
- QB $7.2M
- RB $13.8M
- WR $13.0M
- TE $5.2M
- PK $850,000
- DEF $1.3M
Cap efficiency
Cost per fantasy point — lower is better
- QB $24,576
- RB $52,701
- WR $29,076
- TE $33,412
- PK $3,871
- DEF $8,327
Position composition
27 players on roster
- QB 5 19%
- RB 7 26%
- WR 9 33%
- TE 2 7%
- PK 2 7%
- DEF 2 7%
Age by position
Each dot is a player
Age
Average / range
27.4 Avg age
Youngest Jadarian Price 23
Oldest Nick Folk 42
Age distribution
How your roster splits by age
- ≤23 4
- 24–26 9
- 27–29 5
- 30+ 7
Cap allocation
$45.0M of $45.0M committed
- Active $37.1M 83%
- Practice $750,000 2%
- Injured Reserve $1.6M 4%
- Dead Money $5.5M 12%
- Available $18,256 0%
Roster composition
Active vs IR vs practice vs open
- Active 22 79%
- Practice 3 11%
- Injured Reserve 3 11%
Spend by position
Current-year cap dollars
- QB $2.5M
- RB $13.1M
- WR $14.3M
- TE $6.4M
- PK $1.1M
- DEF $2.0M
Cap efficiency
Cost per fantasy point — lower is better
- QB $3,832
- RB $25,063
- WR $25,651
- TE $20,360
- PK $5,012
- DEF $12,508
Position composition
28 players on roster
- QB 3 11%
- RB 6 21%
- WR 10 36%
- TE 5 18%
- PK 2 7%
- DEF 2 7%
Age by position
Each dot is a player
Age
Average / range
25.8 Avg age
Youngest Jaydon Blue 22
Oldest Justin Tucker 36
Age distribution
How your roster splits by age
- ≤23 6
- 24–26 11
- 27–29 6
- 30+ 3
Cap allocation
$38.4M of $45.0M committed
- Active $32.8M 73%
- Practice $2.0M 4%
- Injured Reserve $600,000 1%
- Dead Money $3.0M 7%
- Available $6.6M 15%
Roster composition
Active vs IR vs practice vs open
- Active 21 84%
- Practice 3 12%
- Injured Reserve 1 4%
Spend by position
Current-year cap dollars
- QB $8.0M
- RB $9.6M
- WR $12.5M
- TE $969,500
- PK $975,000
- DEF $3.4M
Cap efficiency
Cost per fantasy point — lower is better
- QB $35,764
- RB $18,625
- WR $24,238
- TE $5,226
- PK $6,183
- DEF $19,764
Position composition
25 players on roster
- QB 4 16%
- RB 5 20%
- WR 10 40%
- TE 2 8%
- PK 2 8%
- DEF 2 8%
Age by position
Each dot is a player
Age
Average / range
26.8 Avg age
Youngest Carnell Tate 21
Oldest Keenan Allen 34
Age distribution
How your roster splits by age
- ≤23 3
- 24–26 9
- 27–29 7
- 30+ 4
Cap allocation
$37.2M of $45.0M committed
- Active $33.6M 75%
- Practice $1.6M 4%
- Injured Reserve $1.1M 2%
- Dead Money $840,125 2%
- Available $7.8M 17%
Roster composition
Active vs IR vs practice vs open
- Active 20 80%
- Practice 3 12%
- Injured Reserve 1 4%
- Open 1 4%
Spend by position
Current-year cap dollars
- QB $8.7M
- RB $8.1M
- WR $12.7M
- TE $3.3M
- PK $1.4M
- DEF $2.2M
Cap efficiency
Cost per fantasy point — lower is better
- QB $12,702
- RB $19,147
- WR $18,403
- TE $133,413
- PK $11,089
- DEF $11,012
Position composition
24 players on roster
- QB 3 13%
- RB 4 17%
- WR 11 46%
- TE 3 13%
- PK 1 4%
- DEF 2 8%
Age by position
Each dot is a player
Age
Average / range
26.0 Avg age
Youngest Jordyn Tyson 22
Oldest Tyreek Hill 32
Age distribution
How your roster splits by age
- ≤23 5
- 24–26 10
- 27–29 3
- 30+ 4
Cap allocation
$44.4M of $45.0M committed
- Active $27.5M 61%
- Practice $1.0M 2%
- Injured Reserve $12.5M 28%
- Dead Money $3.3M 7%
- Available $641,623 1%
Roster composition
Active vs IR vs practice vs open
- Active 20 74%
- Practice 3 11%
- Injured Reserve 4 15%
Spend by position
Current-year cap dollars
- QB $8.6M
- RB $16.1M
- WR $5.8M
- TE $7.8M
- PK $850,000
- DEF $1.9M
Cap efficiency
Cost per fantasy point — lower is better
- QB $25,047
- RB $39,476
- WR $10,996
- TE $34,916
- PK $5,215
- DEF $10,704
Position composition
27 players on roster
- QB 4 15%
- RB 5 19%
- WR 7 26%
- TE 7 26%
- PK 2 7%
- DEF 2 7%
Age by position
Each dot is a player
Age
Average / range
26.4 Avg age
Youngest Luther Burden 22
Oldest Tyler Higbee 33
Age distribution
How your roster splits by age
- ≤23 6
- 24–26 9
- 27–29 4
- 30+ 6
Cap allocation
$43.5M of $45.0M committed
- Active $35.9M 80%
- Practice $425,000 1%
- Injured Reserve $5.1M 11%
- Dead Money $2.1M 5%
- Available $1.5M 3%
Roster composition
Active vs IR vs practice vs open
- Active 22 88%
- Practice 2 8%
- Injured Reserve 1 4%
Spend by position
Current-year cap dollars
- QB $5.4M
- RB $12.8M
- WR $15.1M
- TE $5.8M
- PK $892,500
- DEF $1.5M
Cap efficiency
Cost per fantasy point — lower is better
- QB $9,863
- RB $31,287
- WR $23,614
- TE $22,504
- PK $3,034
- DEF $7,698
Position composition
25 players on roster
- QB 3 12%
- RB 4 16%
- WR 9 36%
- TE 5 20%
- PK 2 8%
- DEF 2 8%
Age by position
Each dot is a player
Age
Average / range
27.0 Avg age
Youngest Denzel Boston 22
Oldest Jason Myers 35
Age distribution
How your roster splits by age
- ≤23 4
- 24–26 8
- 27–29 4
- 30+ 7
Cap allocation
$41.2M of $45.0M committed
- Active $35.8M 80%
- Practice $475,000 1%
- Injured Reserve $1.6M 3%
- Dead Money $3.4M 7%
- Available $3.8M 8%
Roster composition
Active vs IR vs practice vs open
- Active 22 85%
- Practice 2 8%
- Injured Reserve 2 8%
Spend by position
Current-year cap dollars
- QB $1.7M
- RB $6.7M
- WR $22.6M
- TE $3.5M
- PK $935,000
- DEF $2.4M
Cap efficiency
Cost per fantasy point — lower is better
- QB $7,503
- RB $8,974
- WR $37,774
- TE $16,996
- PK $6,115
- DEF $10,901
Position composition
26 players on roster
- QB 2 8%
- RB 7 27%
- WR 11 42%
- TE 2 8%
- PK 2 8%
- DEF 2 8%
Age by position
Each dot is a player
Age
Average / range
25.2 Avg age
Youngest Jeremiyah Love 21
Oldest Mike Evans 33
Age distribution
How your roster splits by age
- ≤23 9
- 24–26 8
- 27–29 5
- 30+ 2
Cap allocation
$44.6M of $45.0M committed
- Active $39.7M 88%
- Practice $1.6M 3%
- Injured Reserve $2.2M 5%
- Dead Money $1.1M 2%
- Available $415,524 1%
Roster composition
Active vs IR vs practice vs open
- Active 21 75%
- Practice 3 11%
- Injured Reserve 4 14%
Spend by position
Current-year cap dollars
- QB $4.3M
- RB $11.3M
- WR $21.0M
- TE $3.2M
- PK $1.7M
- DEF $2.0M
Cap efficiency
Cost per fantasy point — lower is better
- QB $13,557
- RB $28,188
- WR $34,635
- TE $7,638
- PK $7,832
- DEF $10,687
Position composition
28 players on roster
- QB 4 14%
- RB 6 21%
- WR 8 29%
- TE 5 18%
- PK 3 11%
- DEF 2 7%
Age by position
Each dot is a player
Age
Average / range
25.2 Avg age
Youngest Dylan Sampson 22
Oldest Derrick Henry 32
Age distribution
How your roster splits by age
- ≤23 7
- 24–26 13
- 27–29 4
- 30+ 2
Cap allocation
$44.3M of $45.0M committed
- Active $39.0M 87%
- Practice $962,500 2%
- Injured Reserve $2.4M 5%
- Dead Money $2.0M 4%
- Available $716,909 2%
Roster composition
Active vs IR vs practice vs open
- Active 21 75%
- Practice 3 11%
- Injured Reserve 4 14%
Spend by position
Current-year cap dollars
- QB $5.6M
- RB $10.3M
- WR $19.7M
- TE $4.9M
- PK $514,250
- DEF $1.3M
Cap efficiency
Cost per fantasy point — lower is better
- QB $17,064
- RB $25,573
- WR $36,896
- TE $10,781
- PK $4,727
- DEF $5,622
Position composition
28 players on roster
- QB 4 14%
- RB 7 25%
- WR 9 32%
- TE 5 18%
- PK 1 4%
- DEF 2 7%
Age by position
Each dot is a player
Age
Average / range
26.3 Avg age
Youngest Kyle Williams 23
Oldest Kirk Cousins 38
Age distribution
How your roster splits by age
- ≤23 6
- 24–26 9
- 27–29 7
- 30+ 4
NFL and College Stacks
NFL Analysis
Players on the same NFL team
 Buffalo Bills
D.J. Moore  WR
WR 
Keon Coleman WR
WR  Chicago Bears
Colston Loveland  TE
TE 
Sam Roush TE
TE  Denver Broncos
J.K. Dobbins  RB
RB 
Jaylen Waddle WR
WR  Las Vegas Raiders

Las Vegas Raiders
DEF
Mike Washington Jr. RB
RB  Pittsburgh Steelers
Chris Boswell PK
PK Jaylen Warren RB
RB Rico Dowdle RB
RB  Seattle Seahawks
Emanuel Wilson  RB
RB 
Sam Darnold QB
QB  Washington Commanders
Antonio Williams WR
WR 
Chigoziem Okonkwo TE
TE
Message